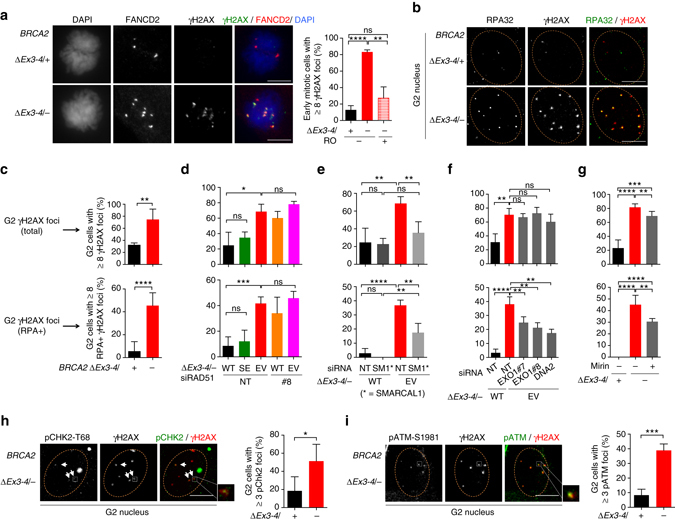
Fig. 8.

BRCA2-deficient cells accumulate single-stranded DNA lesions in G2. a γH2AX foci analysis in early mitotic cells. Cells were untreated, or treated with RO-3306 (10 µM, 24 h) to delay mitotic entry, and released for 1 h before analysis of γH2AX and FANCD2 foci pairs in early mitotic cells. Representative images are shown (left). Analysis is by an unpaired two-tailed t-test. n = 3. Scale bars 10 µm. b–g Cells treated with the indicated siRNAs or mirin (50 µM, 5 h) were incubated with EdU for 30 min and then analyzed for γH2AX and RPA foci in G2 cells (EdU–, 2N DNA content). Representative deconvolved images are shown (b). Quantification of γH2AX foci (top, c–g) and RPA+ γH2AX foci (bottom, c–g) for BRCA2-deficient cells (c), cells transfected with siRNAs (d, RAD51; e SMARCAL1; f EXO1 and DNA2), and cells treated with mirin (g) are shown. n ≥ 3. Scale bars 10 µm. h, i Cells were incubated with EdU as in b before analysis of γH2AX and pCHK2-T68 (h) or pATM-S1981 (i) foci in G2 cells. Representative deconvolved images with magnified inset highlighting foci co-localization are shown (left in each panel). n ≥ 3. Scale bars 10 µm. Error bars s.d. ns, not significant; *p < 0.05; **p < 0.01; ***p < 0.001; ****p < 0.0001 (unpaired two-tailed t-test)
