
Figure 3.
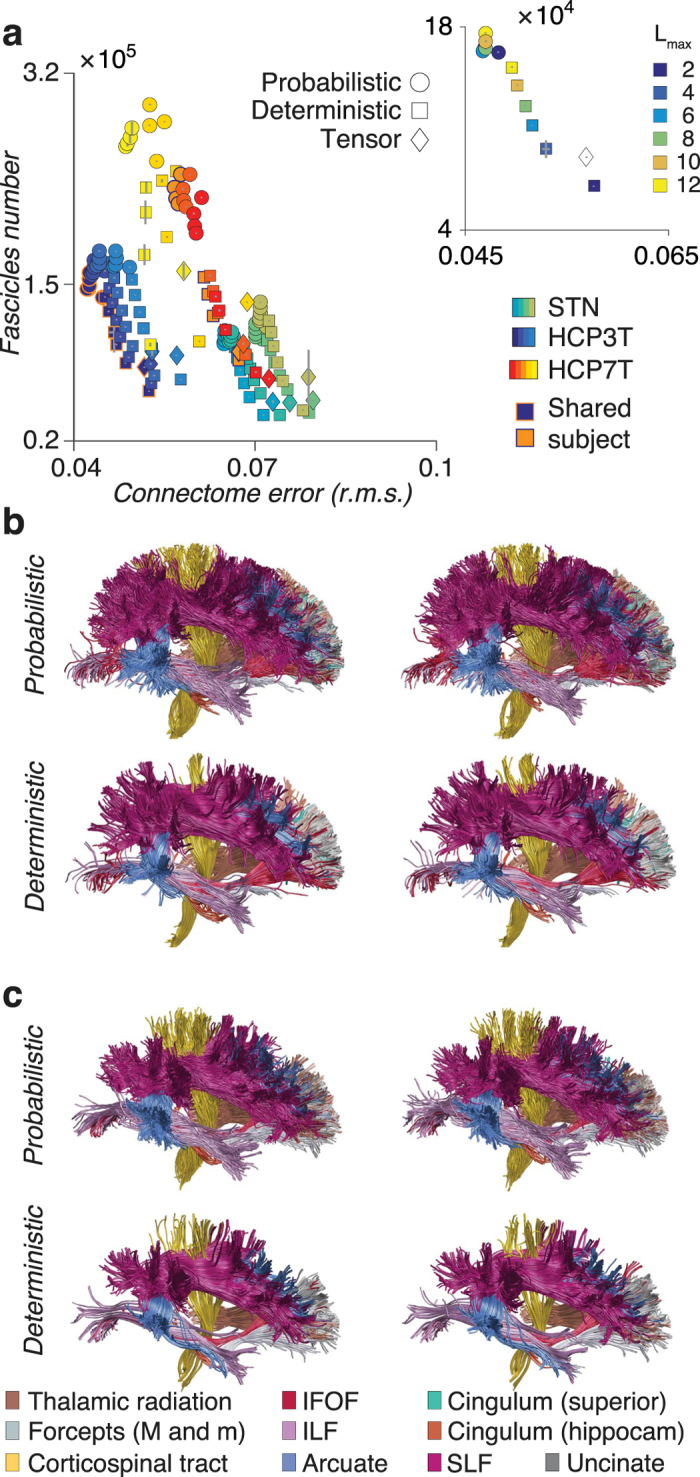
Connectome resolution and anatomical reliability as function of data and method. (a) Scatter plot of number of found fascicles and global r.m.s error in LiFET optimized connectomes (mean ±5 standard error of the mean, s.e.m., N = 1,490, n = 12 subjects, m = 10 repeated tracking, using either 13 or 9 different L max values for either STN, HCP3T or HCP7T). Inset shows the relation between the number of found fascicles (ordinate) and r.m.s. error (abscissa) and L max (color) in one subject from the HCP3T dataset. (b) Reproducibility of connectome anatomy. Twenty major human white matter tracts, two repeated estimates in a single subject probabilistic (top) and deterministic (bottom) tracking, HCP3T dataset. Tracts anatomy is very similar between repeated estimates when using a single tracking method (compare between columns, top and bottom). Estimated tracts anatomy differs within a single subject when the different tracking methods are used (compare between rows, left or right). (c) A different subject from the HCP3T dataset.