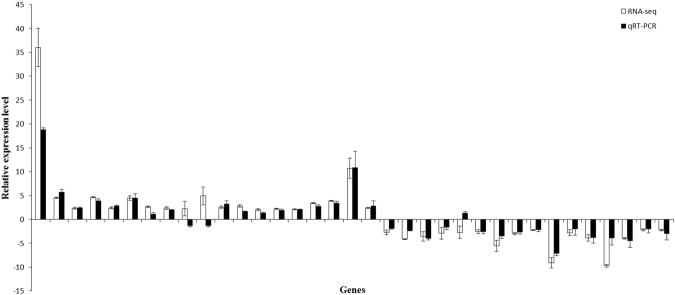
Figure 7.
Comparisons of the relative expression levels determined by qRT-PCR (black bars) and RNA-seq (white bars) for 35 selected DEGs. The y-axis shows the relative expression levels of 35 selected genes. The x-axis indicates the 35 selected genes (from left to right: AT5G44420, AT3G23250, AT4g26200, AT1g17420, AT4G39210, AT4G23700, AT1g29910, AT2G05070, ATCG00120, ATCG00580, AT2G39800, AT2G05100, AT2G34420, AT3G27690, AT5G54270, AT4G39770, AT1G64170, AT1G14540, AT1G70290, AT3g14440, AT4G13250, AT1G78090, AT4G36110, AT5G23370, AT3G24500, AT3G03480, AT4G08390, AT1G05560, AT5G51720, AT4G32810, AT3G12580, AT3G04800, AT1G64900, AT3G44990, and AT1G10070). Bars represent the mean ± SD based on three replicates.

