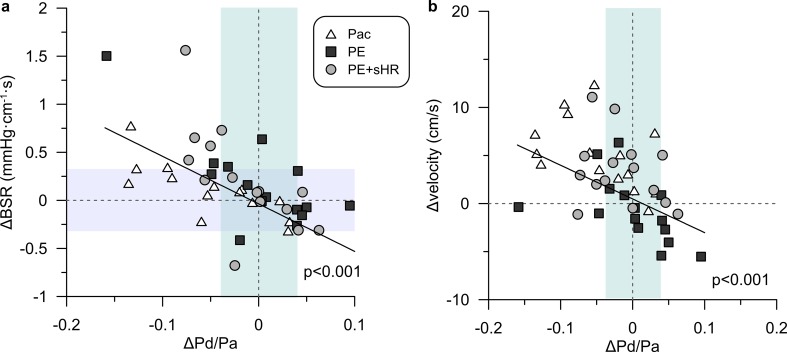
Fig. 6.
Individual changes a in basal stenosis resistance (BSR) and b in baseline flow velocity vs. changes in whole-cycle Pd/Pa induced by metabolic adaptation during the interventions. These changes exceeded the extent of the respective non-ischemic range for each index, as indicated by shaded areas for reference purposes. A significant negative correlation to changes in Pd/Pa across all interventions was found for both the change in BSR and change in flow velocity

