
Fig. 1.
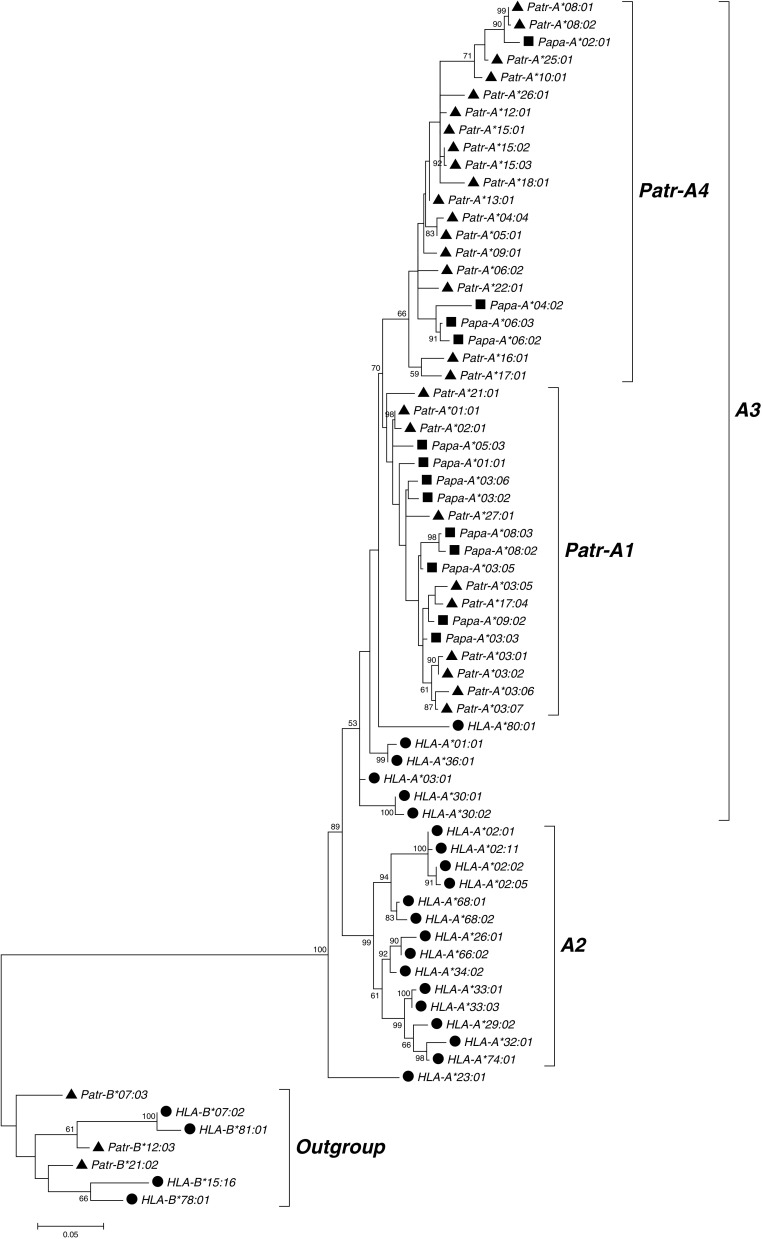
Molecular phylogenetic tree of MHC class I A sequences reconstructed using the maximum likelihood method based on the Tamura 3-parameter model. The model used a discrete gamma distribution allowing evolutionary rate differences among sites. The tree with the highest log likelihood (−5799.1552) is shown. Confidence in the branching patterns is indicated by bootstrap values and only relevant values (≥50) are shown. The scale indicates the number of substitutions per site. The tree was rooted with an outgroup consisting of the indicated MHC-B sequences. The three species humans, chimpanzees, and bonobos are represented by circles, triangles, and squares, respectively, in front of the sequence names. Different phylogenetic groups are defined on the right side of the tree, showing the two MHC-A lineages A2 and A3 and the two chimpanzee- and bonobo-specific groups within the A3 linage Patr-A1 and Patr-A4