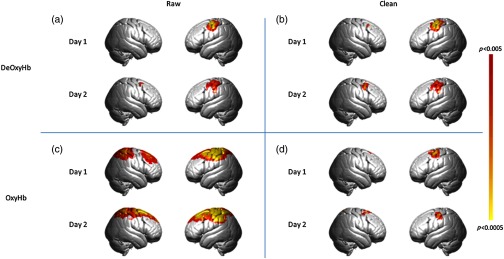
Fig. 2.
Results of all tasks contrast, . The top row represents the group-averaged deOxyHb data; bottom row represents OxyHb data. (a) Results of raw deOxyHb data from day 1 and day 2. (b) Results of clean (spatial filter applied) deOxyHb data from day 1 and day 2. (c) Results of raw OxyHb data from day 1 and day 2. (d) Results of clean (spatial filter applied) OxyHb data from day 1 and day 2.

