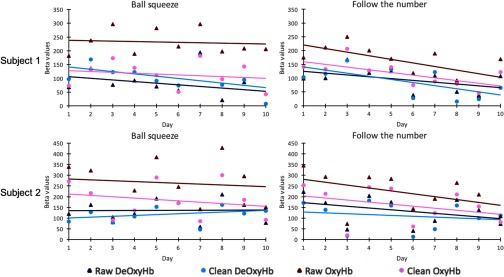
Fig. 3.
Results of 10-day longitudinal study. Top row represents data from participant 1; bottom row represents data from participant 2. Left column shows result of the ball squeeze task; right column shows result of the follow the number task. Daily beta values and trend lines are shown. Red represents OxyHb; blue represents deOxyHb. Dark colors and triangles represent raw data; lighter colors and circles represent clean data.

