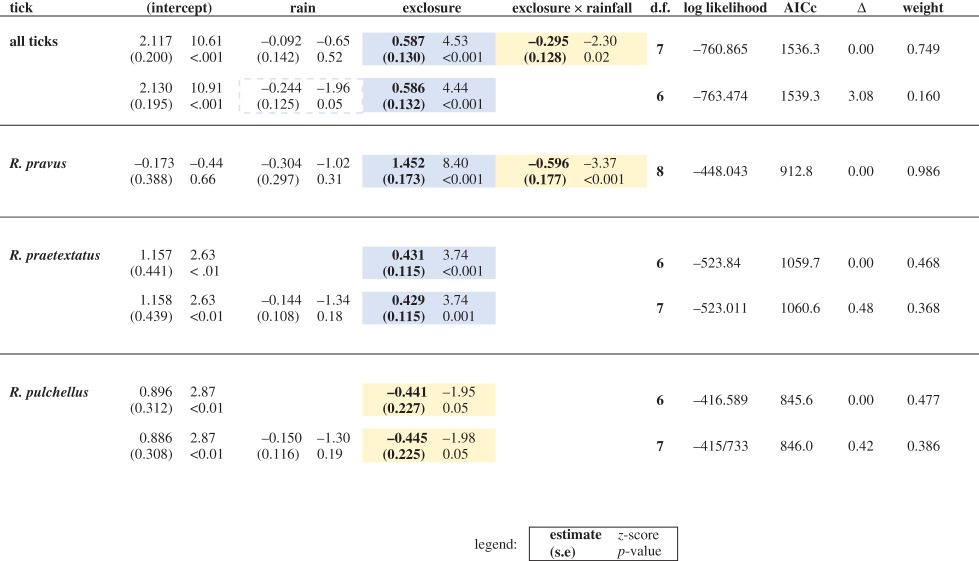
Table 1.
Effects of exclosure treatment, rainfall, and their interaction for all months (Control and Total exclosure plots only) from four GLMMs. Control plots are designated as the reference, and rainfall (millimetres) is scaled by standard error (84 mm) and centred at the mean (533 mm) for ease of interpretation. Significant relationships (p < 0.05) are in bold. Positive relationships are shaded in blue (darker); negative relationships are shaded in yellow (lighter). All estimates are shown with standard errors, z-score (upper right), and p-value (lower right). Full model sets and parameters are shown in electronic supplementary material, table S5. (Online version in colour.)
 |
