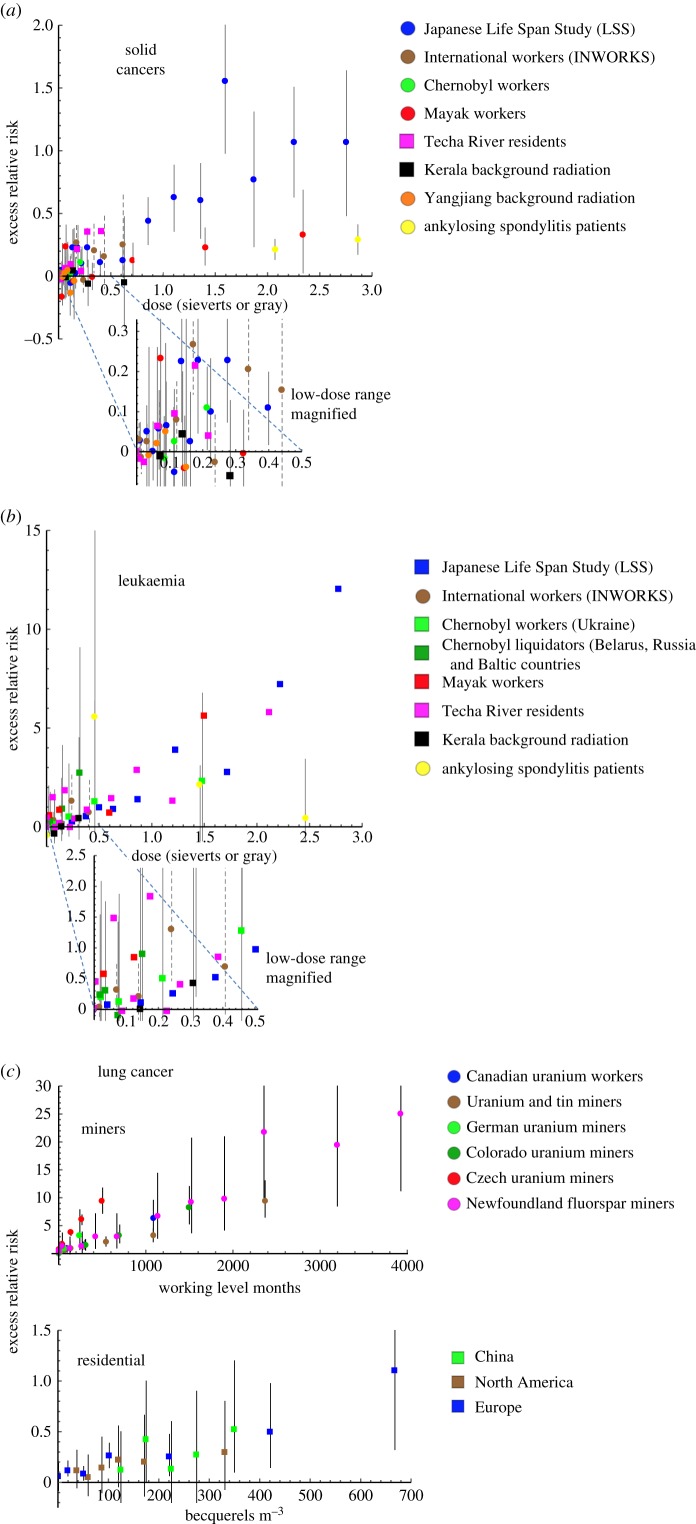
Figure 2.
Estimates of excess relative risk of cancers from large epidemiological studies. The cohorts include a variety of exposure types including via nuclear weapons, occupational exposure in mines or nuclear facilities, environmental contamination from nuclear facilities, naturally high background radiation, medical therapy and radon. Outcomes are mortality (round data points) or incidence (square data points). Confidence intervals have been added where they are available. Dashed lines denote 90% CIs and solid lines denote 95% CIs. Some confidence intervals exceed the range of the y-axis. Table 8 in the electronic supplementary material, at paragraph 23 annotated bibliography (appendix B) contains further detail on these datasets, and see paragraph 37 for explanations of epidemiological association measures used. (a) Solid cancers. The Japanese Life Span Study (LSS) data are for solid cancer mortality in the cohort of survivors of the Japanese atomic bombings. The international workers data are for mortality from all cancers excluding leukaemia in a cohort of French, US and British nuclear workers (INWORKS). The Chernobyl workers data are for solid cancer mortality in a cohort of Russian Federation clean-up workers. The Mayak workers data are for mortality from solid cancers excluding bone, lung and liver cancer in workers at the Mayak weapons plant in Russia. The Techa River residents data are for solid cancer incidence in the cohort of individuals living downstream from the Mayak plant. The Kerala background radiation data are for cancer incidence excluding leukaemia in a cohort of residents of a high background radiation area in India. The Yangjiang background radiation data are for solid cancer mortality in a cohort of residents of a high background radiation area in China. The ankylosing spondylitis data are for solid cancer mortality among UK patients with ankylosing spondylitis treated with X-rays. (b) Leukaemia, excluding CLL. The Japanese Life Span Study (LSS) data are for leukaemia incidence in the cohort of survivors of the Japanese atomic bombings, excluding both CLL and ATL. The international workers data are for mortality from leukaemia excluding CLL in a cohort of French, USA and British nuclear workers (INWORKS). The Chernobyl workers data are for leukaemia incidence excluding CLL in a cohort of Ukrainian clean-up workers, and the Chernobyl liquidators data are for leukaemia incidence excluding CLL in a cohort of workers from Belarus, Russia and Baltic countries. The Mayak workers data are for incidence of leukaemia excluding CLL in workers at the Mayak weapons plant in Russia. The Techa River residents data are for leukaemia incidence excluding CLL in a cohort of individuals living downstream from the Mayak weapons plant in Russia. The Kerala background radiation data are for leukaemia incidence excluding CLL in a cohort of residents of a high background radiation area in India. The ankylosing spondylitis data are for leukaemia excluding CLL mortality among UK patients with ankylosing spondylitis treated with X-rays. (c) Lung cancer following radon exposure. Because of the difference in magnitude in exposures to radon between mining and residential contexts, studies have been split into two charts. The top chart denotes six studies of lung cancer mortality in miners of uranium, tin or fluorspar in relation to cumulative exposure (in ‘working level months’). The uranium and tin miners study consists of 11 pooled international cohorts (including the Newfoundland and Czech cohort). The Newfoundland and Czech single cohort studies have been more recently updated for results and have therefore also been drawn separately. The bottom chart shows residential studies in relation to radon concentration (in Bq m−3). The Chinese residential data are for lung cancer incidence across China; the North America residential data are for lung cancer incidence across North America; and the European residential data are for lung cancer incidence across Europe. (Online version in colour.)

