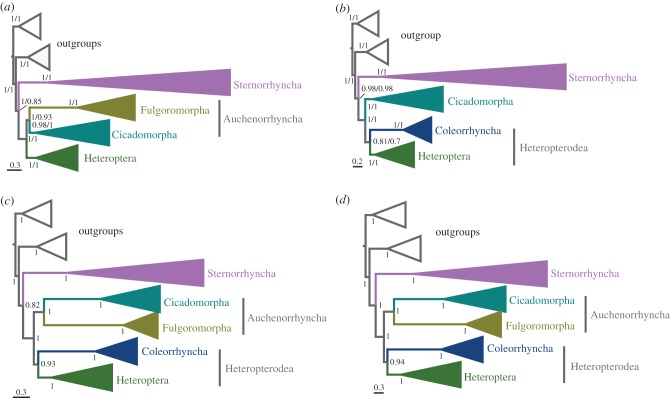
Figure 2.
Phylogenetic trees obtained from PhyloBayes analyses of datasets with improved taxon sampling under the CAT + GTR mixture model. (a) Datasets with the removal of Coleorrhyncha. (b) Datasets with the removal of Fulgoromorpha. In (a,b), values at nodes are Bayesian PPs from the modified PCGRNA (left) and PCG12RNA (right) datasets. (c) PCG12RNA and (d) PCGRNA datasets with the removal of 17 species according to the branch length and the heterogeneity in sequence divergence (see the electronic supplementary material, figure S11). We show a schematic version of the Bayesian trees with some suborders and infraorders collapsed for clarity.

