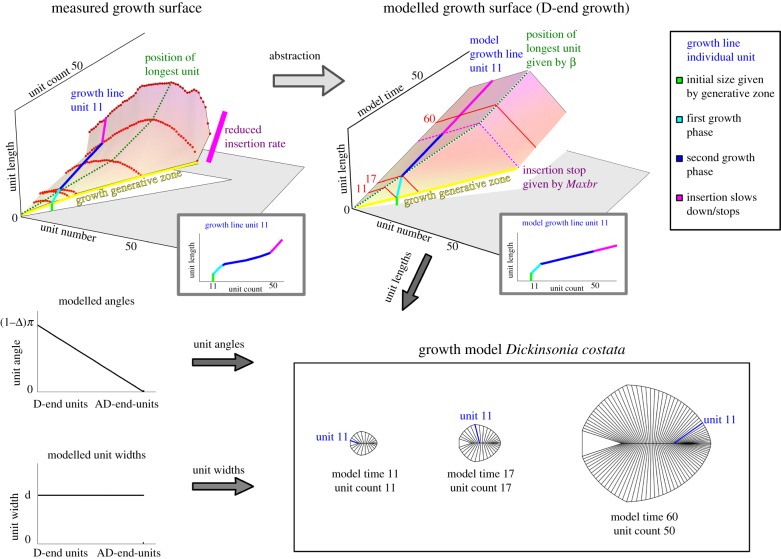
Figure 4.
Translation of the growth surface for D. costata specimen data (from uncontracted specimens) to a modelled growth surface, which renders unit lengths as a function of unit number and model time. Insets illustrate the measured and modelled growth of an individual unit, analogous to the growth lines in figure 3b. Each unit slows its relative growth after it has become the longest unit. With the additional input of unit angles and widths, this information can be used to render a model morphology at each point in time (see the interactive applet). (Online version in colour.)

