Figure 1:
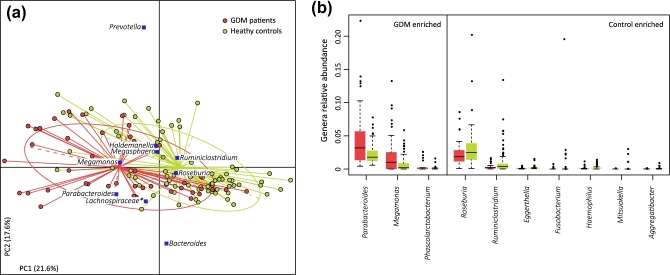
Difference in microbial composition between GDM and healthy pregnant women. (a) Distance-based redundancy analysis based on Bray–Curtis distances between microbial genera, revealing a GDM dysbiosis that overlaps only in part with taxonomic composition in GDM patients and healthy controls. The first 2 principal components (PCs) and the ratio of variance contributed by them is shown. Lines connect samples in the same group, and colored circles cover the samples near the center of gravity for each group. Genera (blue square), as the main contributors, are plotted by their loading in the PCs. (b) Boxplot shows genera that differ significantly between GDM patients and healthy controls. Genera with q < 0.05 (Mann–Whitney U test corrected by the Benjamini–Hochberg method) are shown. Red and green boxes represent GDM patients and healthy controls, respectively. Only the genera with average relative abundances greater than 0.05% in all the samples are shown for clarity. The boxes represent the interquartile range (IQR) between the first and third quartiles, and the line inside represents the median. The whiskers denote the lowest and highest values within 1.5 times IQR from the first and third quartiles, respectively. The circles represent outliers beyond the whiskers.

