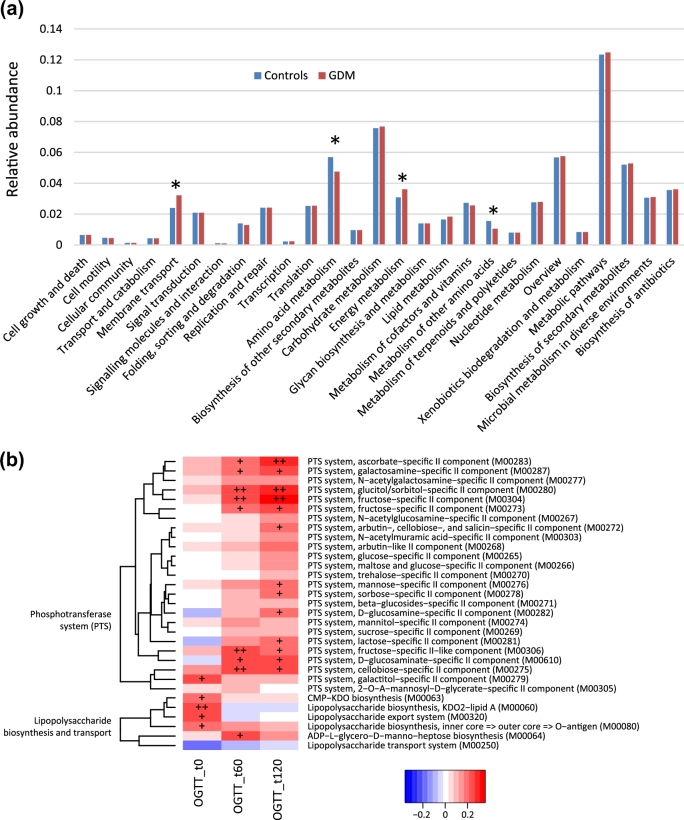
Figure 5:
Association of microbial genetic functional pathway composition in GDM patients and healthy pregnant women. (a) Distributions of relative abundances of KEGG pathway categories in GDM patients and healthy controls. The asterisk denotes q < 0.05 (Mann–Whitney U test corrected by the Benjamini–Hochberg method). (b) Correlation of blood glucose levels 0, 60, and 120 minutes after an oral glucose tolerance test, with PTS system and LPS biosynthesis and transport system. Spearman's rank correlation coefficients and P-values for the correlations are shown. The plus sign denotes P < 0.05; double plus sign denotes P < 0.01.

