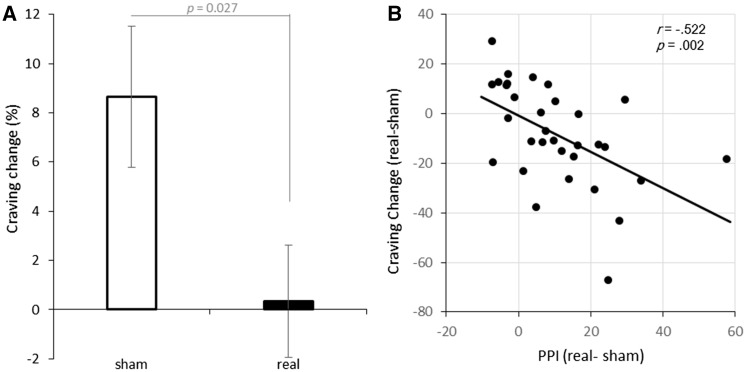
Fig. 4.
(A) Craving change (%) across cue-reactivity task in sham and real stimulation. The length of the error bar represents the standard error of the mean. (B) The changes of PPI between lDLPFC and rPHG across the two sessions (real–sham) correlated with the craving changes across the two sessions (real–sham).

