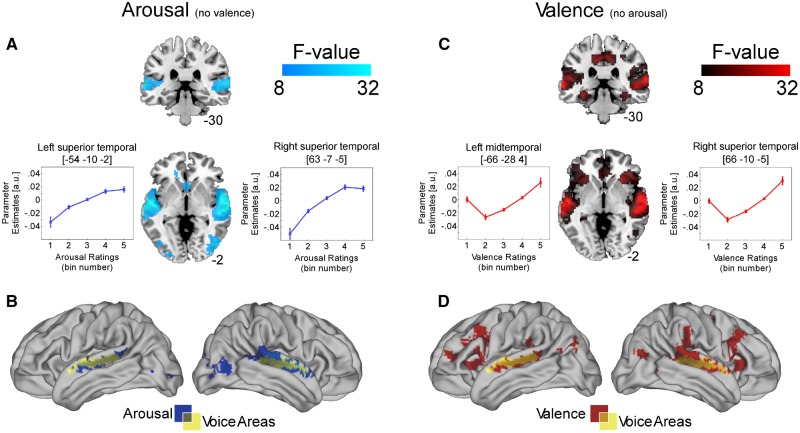
Fig. 3.
Activation maps of significant correlations between BOLD signal and (A) arousal after variance explained by valence has been removed. Significant relationships are evident in bilateral superior temporal gyri and right mid-occipital cortex. Overlap between this activation (blue) and that of the voice localiser (yellow) is shown in (B). Activation maps of significant correlations between BOLD signal and (C) valence after variance explained by arousal has been removed. Significant relationships are evident in bilateral superior temporal gyri, inferior frontal gyri, hippocampi, medial orbitofrontal, superior frontal gyri and midcingulum. Overlap between this activation (red) and that of the voice localiser (yellow) is shown in (D). Activations in (A) and (C) are illustrated on a T1-weighted average structural template. The line graphs illustrate BOLD signal change in response to the behavioural ratings (from 0 to 1; low to high arousal and negative to positive valence, respectively, in five bins of 0.2).

