
Fig. 1.
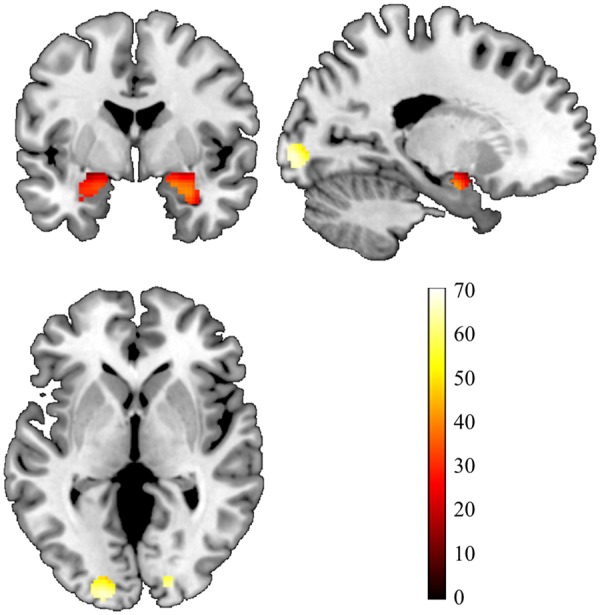
Amygdala and primary visual cortex from the Faces > Shapes contrast of the fMRI task. Statistical parametric map illustrating bilateral amygdala and primary visual cortex (V1) activation clusters for the contrast ‘Faces > Shapes’ with bilateral ROIs for the amygdala (defined by the automatic anatomical labeling option in the Wake Forest University PickAtlas) and bilateral V1 [defined by 7 mm spheres centered on the peak voxels of activation within V1 (18, −90, −6 and −18, −95, −2)], overlaid onto a canonical structural brain image Montreal Neurological Institute coordinates and statistics (P<0.05, family-wise error whole-brain corrected and ≥10 contiguous voxels). The displayed image is centered on MNI coordinates [−20, −1, 0].