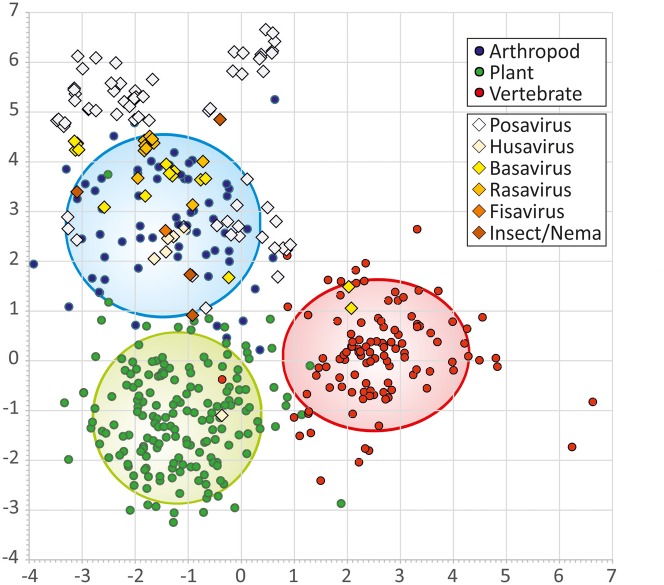
Figure 4.
Discriminant analysis of the dinucleotide bias in PPLVs compared to members of the Picornaviridae for which the infectious host is known. Viruses infecting arthropods are indicated with blue circles, viruses infecting plants in green circles and viruses infecting vertebrates in red circles. The lines indicate the 95% interval. Posaviruses are plotted in white diagonals, husavirus in light yellow, basavirus in yellow, rasavirus in dark yellow, fisavirus in orange and insect/nematode infecting viruses in dark orange.

