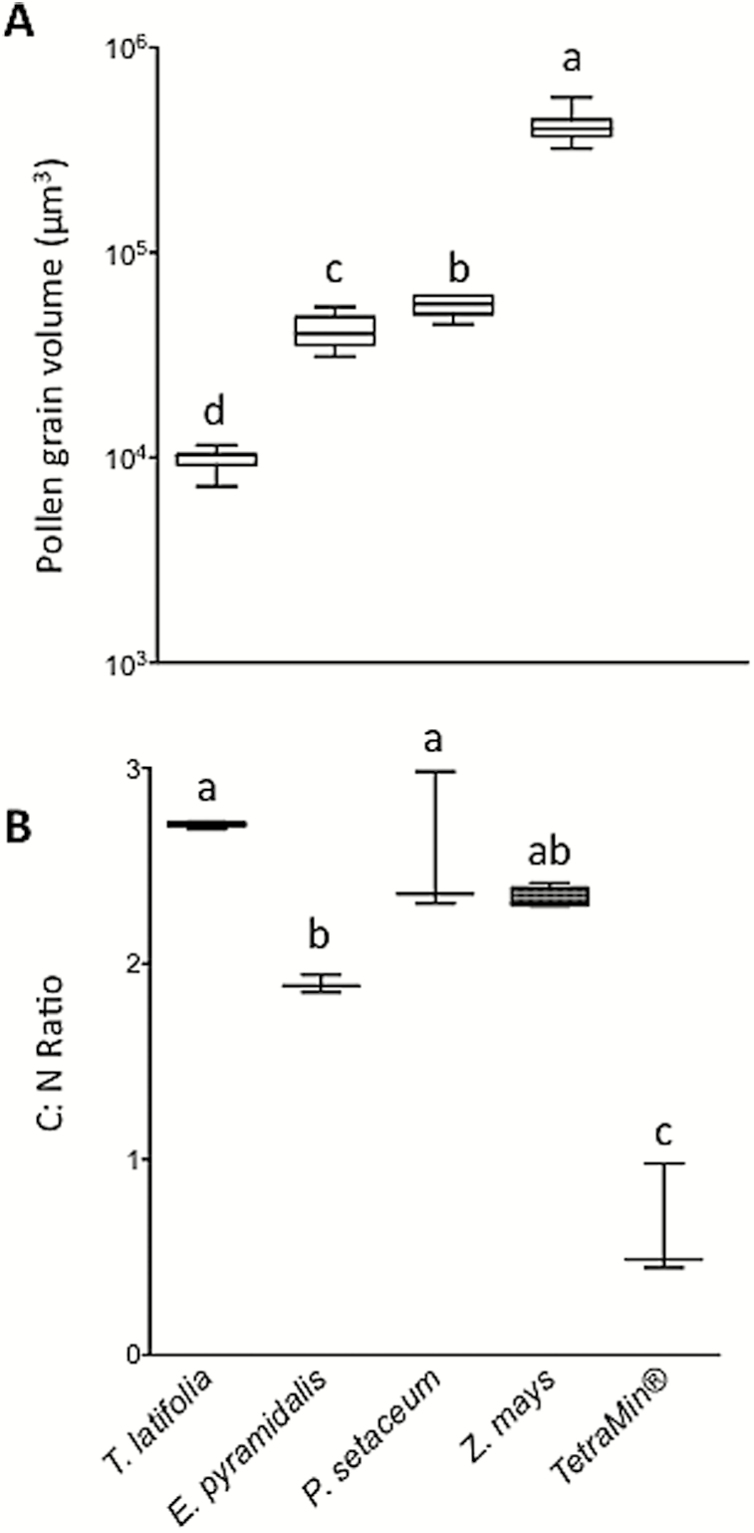
Fig. 1.
Size (A) and carbon to nitrogen (C:N) ratios (B) of Typha latifolia, Echinochloa pyramidalis, Pennisetum setaceum, and Zea mays pollen are described in box plots (whiskers ± maximum and minimum values). The C:N ratio of the TetraMin control is also shown. Means with different letter designations are significantly different from one another (analysis of variance with Tukey’s HSD post hoc analysis; P < 0.05).

