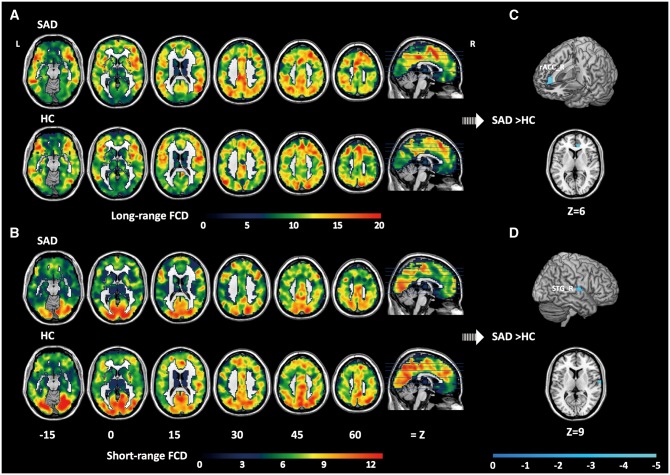
Fig. 1.
Results of FCD analysis. Distribution of long-range (A) and short-range (B) FCD in the brain for the SAD and HC groups. Brain regions exhibiting significant differences in long-range (C) and short-range (D) FCD between the two groups. For (C) and (D), significant clusters are shown on the surface-rendered brain, and in axial (Z) views at the peak effect coordinates. All maps are thresholded at FWE < 0.05, with SVC for multiple comparisons, in a contiguous cluster of at least 20 voxels (K > 20). Colour bars represent t values. rACC, rostral anterior cingulate cortex; STG, superior temporal gyrus; L, left hemisphere; R, right hemisphere; FCD, functional connectivity density; SAD, social anxiety disorder; HC, healthy control.

