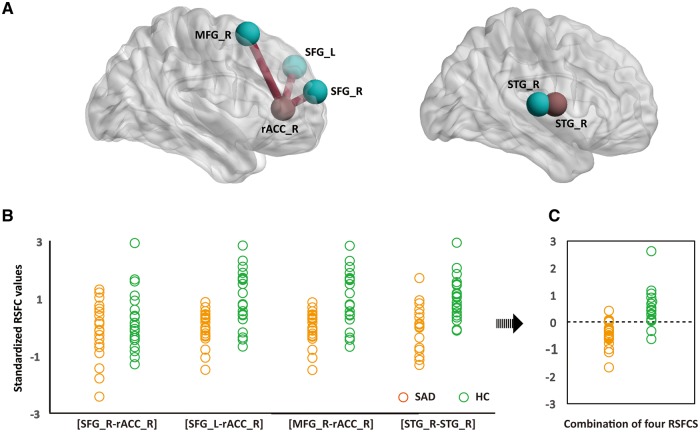
Fig. 4.
Results of discriminant analysis. RSFC among four brain regions (blue) and two abnormal FCD regions (red) contributed most substantially to individual diagnoses of SAD (A). Standardised values of each contributing RSFC pattern for each participant of the SAD (orange) and HC (green) group are shown (B). The discriminant analysis based on the four contributing RSFC patterns obtained an accuracy of 85.4% (C). The dotted line represents the value of the threshold for the classification (canonical coefficient = 0.752, eigenvalue = 1.298, Wilks’ Lambda = 0.435, P < 0.001) (D). rACC, rostral anterior cingulate cortex; STG, superior temporal gyrus; SFG, superior frontal gyrus; MFG, middle frontal gyrus; L, left hemisphere; R, right hemisphere; RSFC, resting-state functional connectivity; SAD, social anxiety disorder; HC, healthy control.

