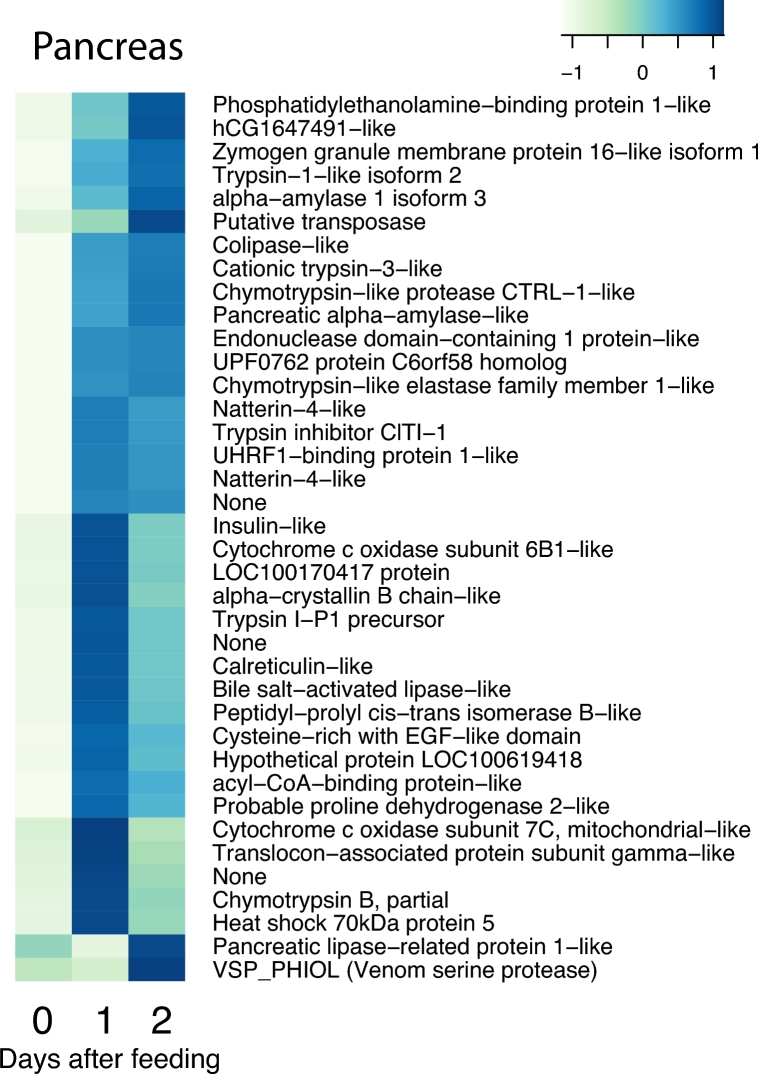
Figure 8:
The cluster of upregulated genes with NCBI nr annotation in the pancreas. The figure represents cluster d in Fig. 3. Heat map columns represent samples, and rows correspond to genes. Expression values (FPKM) are log2-transformed and then median-centred by gene. Relative levels of gene expression are represented by colours. Pale colour is low expression, and darker blue is high expression.

