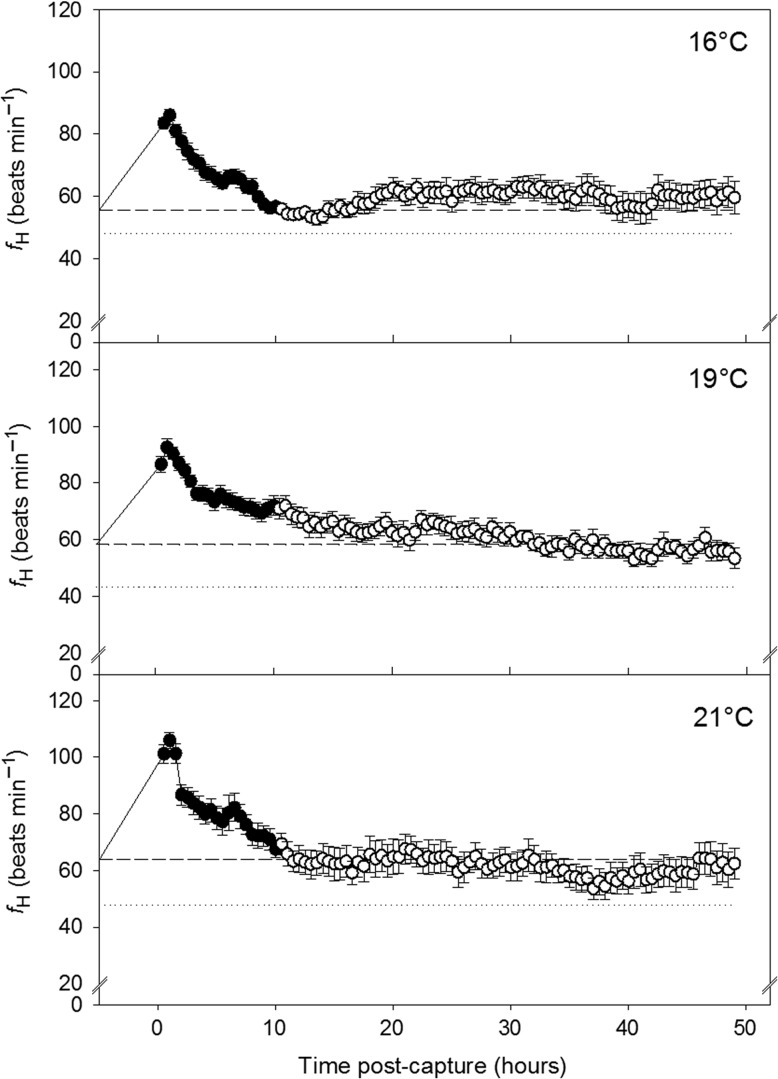
Figure 3:
Sockeye salmon mean (±SE) heart rate (fH) recovery profiles (black circles), resting fH (mean lowest 10th percentile of fH from the entire experiment) (dotted line), and routine fH (mean recovery fH determined by breakpoint regression analysis) (dashed line) over time (hours) since fisheries capture simulation in 16°C (top), 19°C (middle) and 21°C (bottom) water. Black circles represent fH recovery during the first 10 h of recovery. White circles show fH recovery from 11 to 48 h post-fisheries simulation. Time 0 represents the fisheries capture simulation start time, and fH was monitored for the next 48 h.

