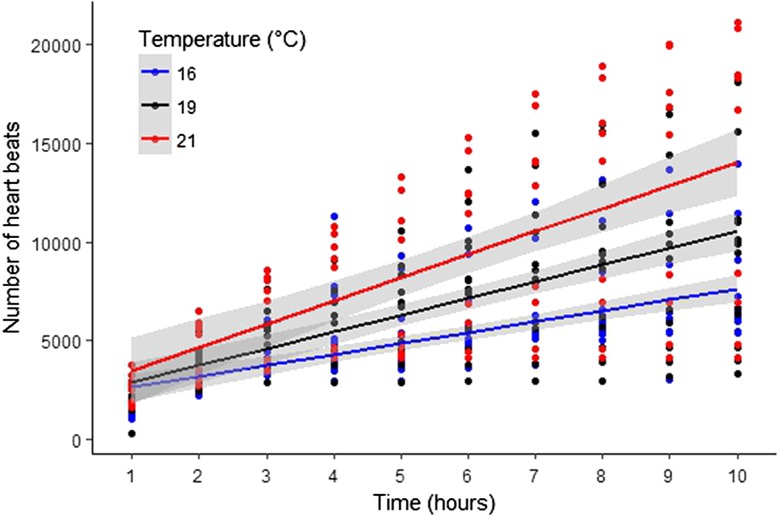
Figure 4:
Regression plot showing the variability of cumulative excess post-exercise heart beats (EPHB) (beats) within temperature treatments, and the general relationship between temperature treatments according to the linear mixed effect model with individual fish as repeated measures, against the recovery time in hours post-fisheries capture simulation. The 16°C treatment (N = 13) is denoted by the blue circles and the blue regression line, the 19°C (N = 13) treatment is denoted by the black circles and black regression line, and the 21°C treatment (N = 9) is denoted by the red circles and red regression line. The shaded area around each regression line represents the 95% confidence region. Time 0 represents the start of the fisheries capture simulation.

