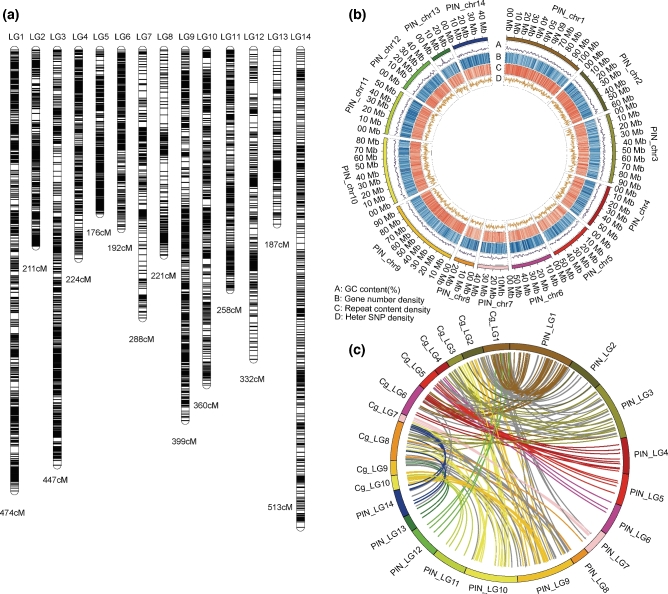
Figure 1:
Genome organization of P. f. martensii. (a) Genetic map of P. f. martensii constructed with RAD SNPs. The lines on linkage groups represent SNP positions. (b) The distribution of GC, gene, repetitive elements, and SNPs on P. f. martensii pseudochromosomes. (c) Synteny blocks between C. gigas (Cg) and P. f. martensii (PIN).

