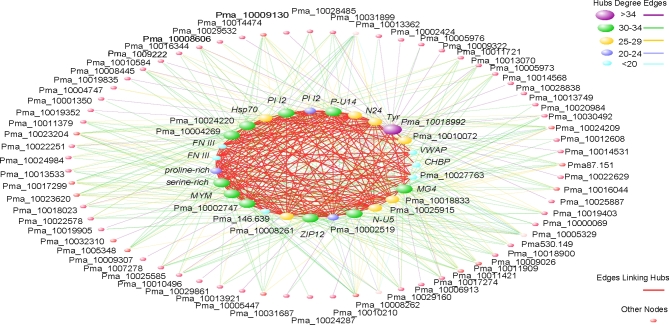
Figure 4:
Co-expression network of nacre formation–related genes of P. f. martensii. Hub genes are illustrated in the internal circle, where connections among them are coloured red. The number of visible links for each hub gene is represented by the size of the node. Links and their corresponding hub genes are in the same colour.

