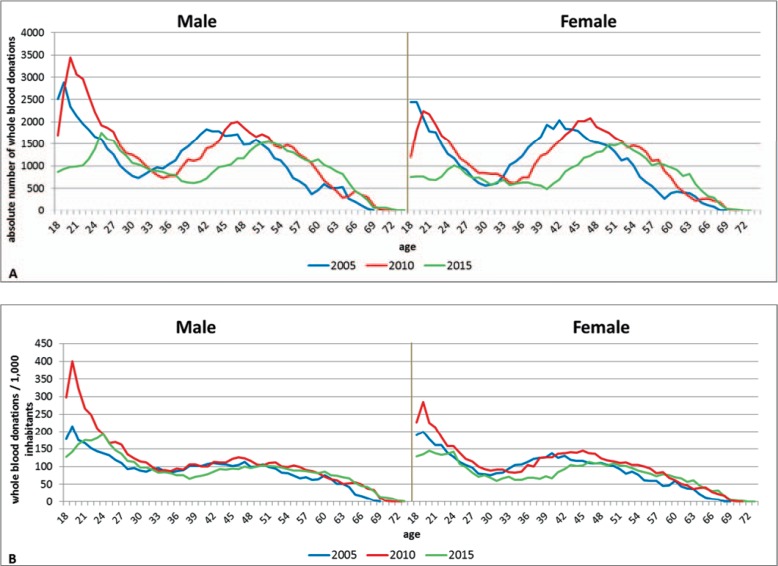
Fig. 3.
A Absolute number of whole blood donations by sex. Absolute numbers of whole blood donations decreased in Mecklenburg-Western Pomerania between 2005 and 2015, primarily because of a decline in the younger age groups. In addition the peak of blood donations in the group >40 years of age shifts and parallels aging of the baby boomer generation. This indicates that in 10–15 years the blood donors who contribute today a large proportion of whole blood donations will leave the donor pool, without sufficient replacement by younger donors. These effects are similar for male and female donors. B Whole blood donations per 1,000 inhabitants by sex. The change in blood donations per 1,000 inhabitants of this age group is much less pronounced than the changes shown in figure 3A. This indicates that the decrease of blood donations is primarily caused by the demographic change. In women, however, there is an additional decrease of blood donations which adds to the donor loss by the demographic change.

