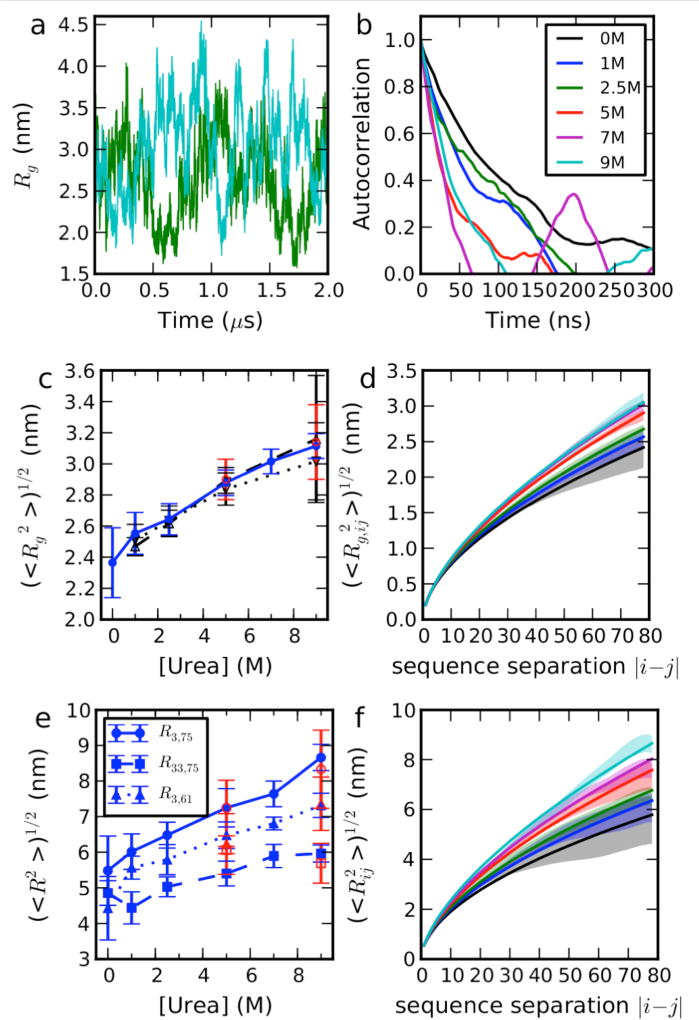
Figure 1.
Equilibrium properties of ACTR in Urea. (a) Fluctuations in Rg over time at selected denaturant concentrations, concentration as labeled in (b). (b) Time correlation functions for Rg. (c) Dependence of mean Rg from simulations (blue solid line, filled circles), Guinier fit of SAXS intensity with q < 0.04 Å−1 from explicit solvent calculation (black dash line, up triangles) and from implicit solvent calculation (black dotted line, down triangles). Red symbols show the data from large box simulations (see Table S1). (d) the dependence of the Rg included between residues i and j on the sequence separation |i − j|. (e) Dependence of root mean square intramolecular distances on denaturant concentration. Red symbols show data from large box simulations (see Table S1). (f) Dependence of root-mean-square distance between i and j on |i − j|. Scaling exponents were calculated by fitting a power law to the dependence on sequence separation |i − j| of either the root mean square distance between i and j in (f) or the Rg of the chain included between residues i and j. Solid lines show fits to and , in which lp=0.4 nm and b = 0.38 nm35 (the expression for Rg is an approximation which assumes Flory scaling to hold for all i,j pairs, although it is only strictly valid for sufficiently large |i − j|). Simulation error bars are obtained from block averages, as described in the SI text, and refer to the standard error of the mean.

