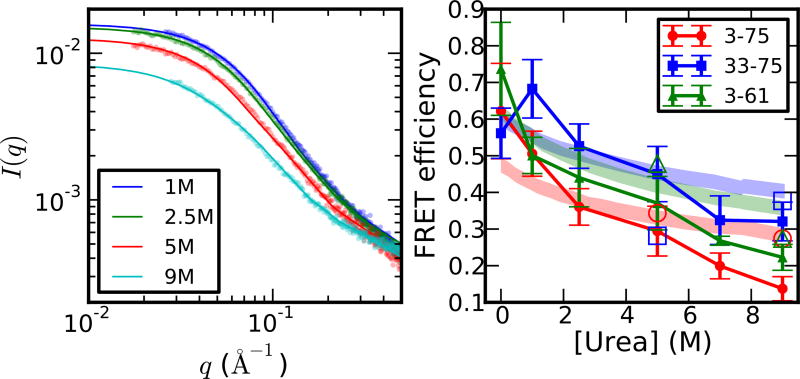
Figure 4.
Comparison with experimental observables. Left: SAXS; Right: FRET. Experimental data (from Ref70) and uncertainties are represented by shaded areas and simulation data by solid lines. Solid symbols show the results of simulations with a common box size (12 nm rhombic dodecahedron), and open symbols the results using larger box sizes (15 nm and 17 nm at 5 M and 7 M, respectively). Large box simulations were run for 0.6 µs versus 2 µs for the small box simulations. For calculating FRET efficiencies, the distance between the Cα atoms of the labeled residues has been rescaled by a factor as detailed in the Methods section. For FRET, simulation error bars give the standard error of the mean and the shaded regions account for the systematic error in experiment.

