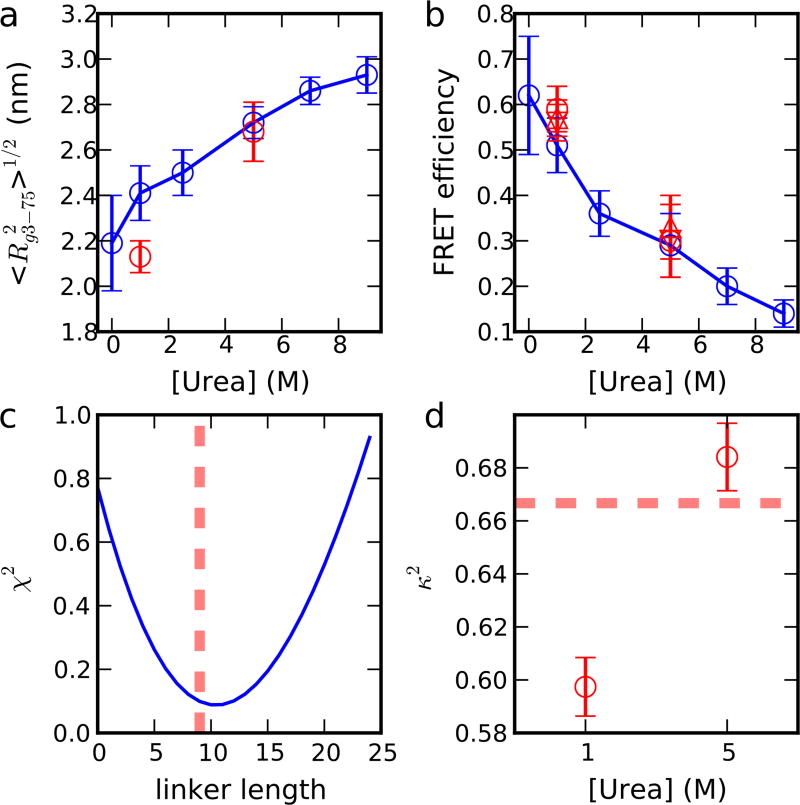
Figure 5.
Explicit and implicit treatment of dyes in FRET calculation. (a) Rg of residue 3–75 fragment for simulation with dyes (red) and without dyes (blue). (b) FRET efficiency for simulation with dyes (red) and without dyes (blue). For simulations with dyes, FRET efficiency is estimated from three different ways described in the Methods section, including Cα distance with a correction of linker length of 9 residues (circle), C1 distance without the correction (lower triangle), and integration of the intensity decay directly. (c) Variation of χ2 between the two ways of calculating FRET efficiency described in (b) as a function of the linker length, and the linker length obtained from the experiment (dash line). (d) κ2 of dyes in the simulation and the value expected for complete rotational averaging (dash line). Error bars are the standard error of the mean, computed from block averages.

