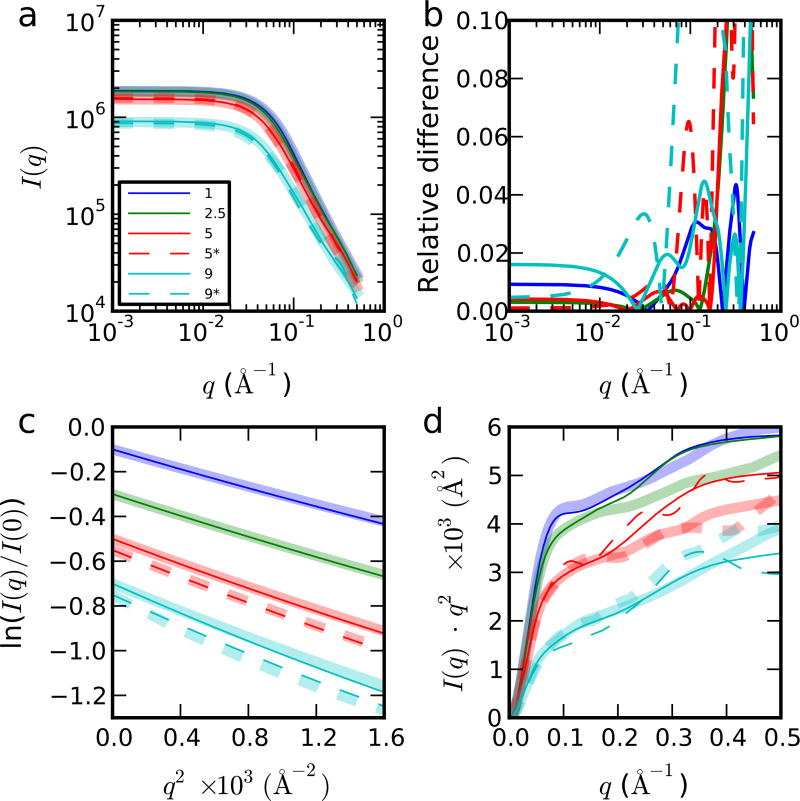
Figure 6.
Explicit (always shown by the thick curve in (a), (c) and (d)) and implicit (thin line) treatment of solvent in SAXS calculation. (a) Log-log plot of scattering intensity with legend showing the urea concentration. Dashed lines (* in legend) indicate simulations with a larger simulation box at 5 and 9 M urea. (b) Relative difference between the scattering intensity of explicit and implicit treatment of solvent in SAXS calculation, |Iimplicit(q) − Iexplicit(q)|/Iexplicit(q). (c) Guinier plot. (d) Kratky plot. We obtain essentially identical results either from all-atom or CRYSOL calculation at low scattering angles (i.e. solvent structuring does not influence the measured Rg). For all the comparisons, the scattering intensity from implicit treatment of solvent is scaled by a factor α to minimize Σq (αIimplicit(q) − Iexplicit(q))2, to correct for differences of scattering intensities between simulation and experiment.

