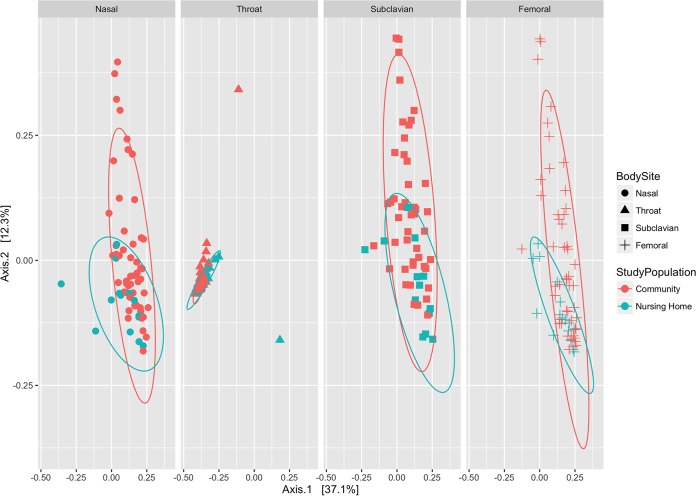
FIG 2 .
PCoA results for beta diversity metrics between study populations by body site, showing distances from the Jensen-Shannon divergence. The eight ellipses represent 95% confidence intervals for clustered specimens from older adults from the nursing home and community study populations at each of the four body sites. ANOSIM test of significance results: nasal, R =0.1463, P = 0.04; throat, R = 0.3401, P = 0.003; subclavian skin, R = 0.04798, P = 0.297; femoral skin, R = 0.1815, P = 0.026.

