FIG 4 .
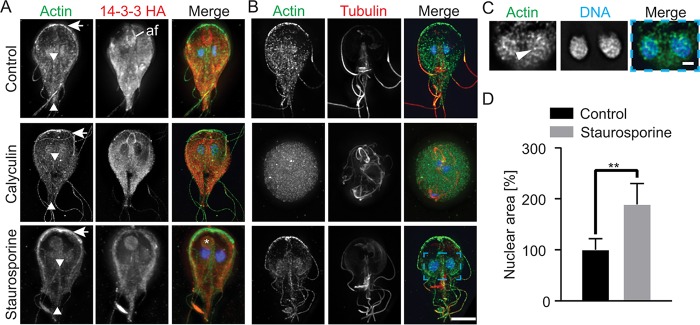
Filamentous actin structures are depleted by calyculin A treatment and enhanced by staurosporine treatment. (A) Projected images of actin (green), Gl-14-3-3–HA (red), and DNA (blue) in the presence of calyculin A and staurosporine. Arrows mark the anterior of the cell where actin intensity is reduced by calyculin A treatment (increased phosphorylation) but enhanced by staurosporine treatment (reduced phosphorylation). Arrowheads mark the intracytoplasmic caudal flagella axonemes, which are typically associated with actin. Note that calyculin A treatment resulted in loss of actin association with this structure, while staurosporine treatment increased actin association. Calyculin A treatment enriched Gl-14-3-3–HA along the intracytoplasmic axoneme of the anterior flagella (af). An asterisk marks the aberrant structure found in 30% of staurosporine-treated cells. Note this structure is associated with the bare region of the disc, a conduit of cellular trafficking. (B) Projected images of actin (green), tubulin (red), and DNA (blue) in the presence of calyculin A and staurosporine. Note that 27% of calyculin A-treated cells lost cytoskeletal organization and adopted a rounded cell shape. Scale bar, 5 µm. Nuclear area increased after staurosporine treatment. (C) A single optical section enlarged from the blue box in panel B showing actin filaments associated with the nuclei. An arrowhead marks a prominent filament. (D) Nuclear area quantified after treatment with staurosporine (control [DMSO], n = 22; staurosporine, n = 64). Values are means ± SD. **, P < 0.01. Scale bar, 1 µm.

