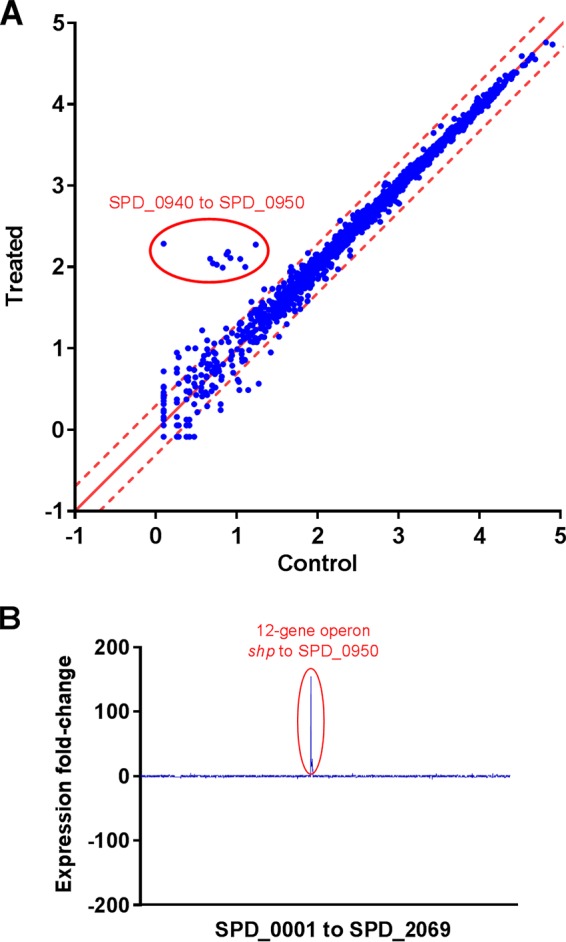
FIG 2 .

Transcriptome analysis. (A) Scatterplot of global mRNA expression of S. pneumoniae D39 with and without addition of the S. pneumoniae sSHP (specific). Both axes show mRNA expression (number of reads) on a log10 scale. The dashed red lines represent 2-fold up- and downregulation. The operon downstream of shp was highly upregulated (circle). Only annotated genes were included in this analysis; therefore, shp is not present. (B) Fold change in gene expression in the genome of S. pneumoniae D39 when the sSHP is added to the culture. The x axis shows gene names in accordance with NCBI Protein Coding Genes. Pseudogenes and tRNA were excluded from the final analyses.
