
FIG 8 .
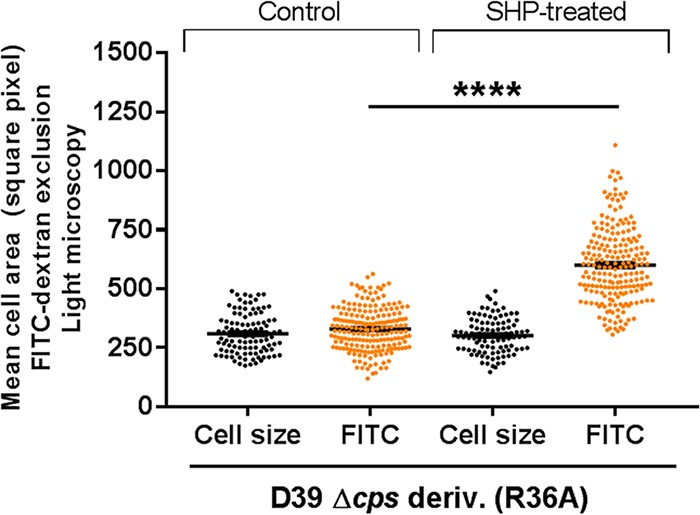
Production of surface polysaccharides following treatment with synthetic SHP. Each dot represents the measurement of the FITC-dextran exclusion area for a single cell, and bars represent the mean and the standard error of the mean of each group. ****, P < 0.0001.