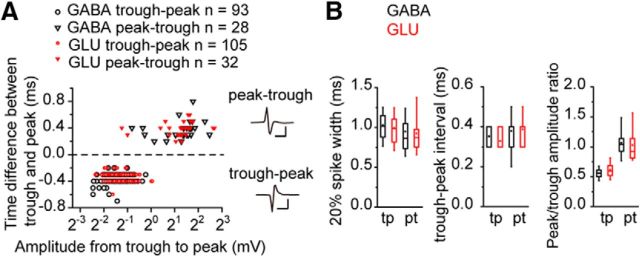
Figure 1.
GABAergic and glutamatergic neurons in the IC had similar spike widths. A, The time difference between trough and peak was plotted against the spike amplitude. The positive time difference means that the peak preceded the trough and vice versa. Both in the GABAergic (black, left) and the glutamatergic (red, right) neurons, the peak preceded the trough in large spikes (inverted triangles), whereas the trough preceded the peak in small spikes (circles). Calibration: Top, 2 mV, 1 ms; Bottom, 0.2 mV, 1 ms. B, Box plots of the spike width, trough-peak interval, and peak/trough amplitude ratio of each spike type. In this and the subsequent box plots, the box represents 25th, 50th, and 75th percentiles. Whiskers represent 10th and 90th percentiles. Square in the box represents the mean value. tp, Trough-peak; pt, peak-trough.

