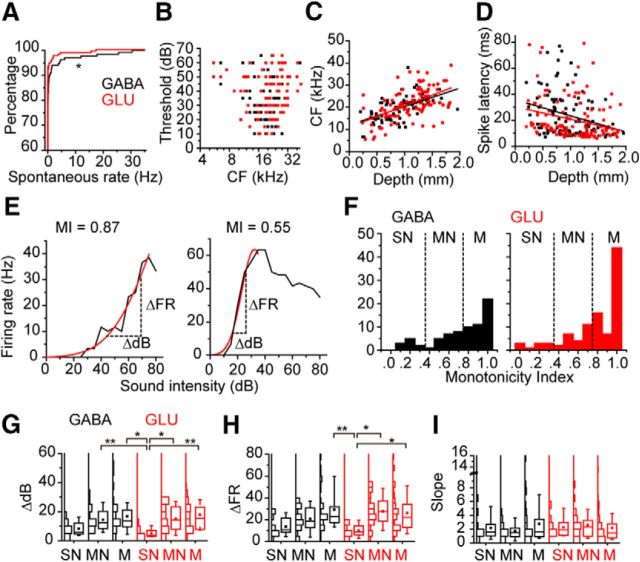
Figure 2.
The spontaneous firing rates and the response to CF tones of the GABAergic and glutamatergic neurons in the IC. A, The spontaneous firing rates of GABAergic (black) and glutamatergic (red) neurons were plotted by probabilistic curves. *p < 0.05. B, The threshold sound intensities of the GABAergic (black square) and glutamatergic (red squares) neurons plotted relative to the CFs. C, CF was plotted against the depth of the recording site. Black lines indicate the fitted line for the data of the GABAergic neurons. Red lines indicate the fitted line for the data of the glutamatergic neurons (y = 11.92 + 0.0084x, and y = 10.97 + 0.0096x). D, Spike latency was plotted against the depth of the recording site. Black lines indicate the fitted line for the data of the GABAergic neurons. Red lines indicate the fitted line for the data of the glutamatergic neurons (y = 35.74 − 0.012x, and y = 30.38 − 0.0096x). E, The examples of the RLFs. Both were recorded from GABAergic neurons. Left, Monotonic RLFs. Right, Nonmonotonic RLFs. Horizontal dotted lines indicate the ΔdB. Vertical dotted lines indicate the ΔFR. F, The histograms of MIs. Dotted lines indicate the border of monotonic (M), moderate nonmonotonic (NM), and strong nonmonotonic (SN). G–I, Box plots of ΔdB (G), ΔFR (H), and slope (I). Boxplots were presented with histograms (left to boxplots). *p < 0.05; **p < 0.01.

