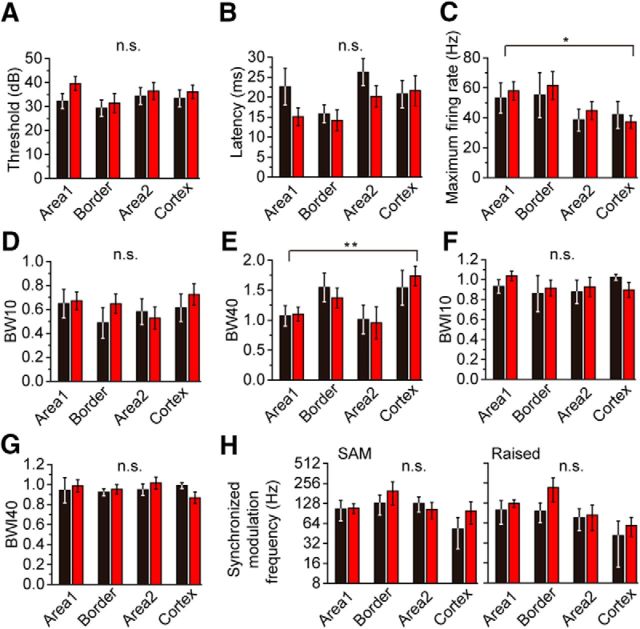
Figure 8.
Comparison of the response characters in different subregions in the IC. Individual metrics of the response to sound compared among the subregions in the IC. A, Threshold, GABA (black); n = 18, n = 13, n = 15, and n = 12 for Area 1, border, Area 2, and cortex, respectively. The order of the numbers for the different regions is the same in the subsequent descriptions. GLU (red); n = 32, n = 14, n = 14, and n = 23. B, Latency, GABA; n = 17, n = 16, n = 22, and n = 12. GLU; n = 31, n = 17, n = 24, and n = 22. C, Maximum rate, GABA; n = 15, n = 6, n = 14, and n = 10. GLU; n = 31, n = 14, n = 15, and n = 20. D, BW10, GABA; n = 15, n = 6, n = 14, and n = 10. GLU; n = 31, n = 14, n = 15, and n = 20. E, BW40, GABA; n = 12, n = 6, n = 9, and n = 6. GLU; n = 14, n = 9, n = 8, and n = 15. F, BWI10, GABA; n = 15, n = 6, n = 13, and n = 10. GLU; n = 31, n = 14, n = 15, and n = 20. G, BWI40, GABA; n = 12, n = 6, n = 9, and n = 6. GLU; n = 14, n = 9, n = 8, and n = 15. H, The highest modulation frequency with synchronization to SAM (left, GABA; n = 13, n = 6, n = 11, and n = 9. GLU; n = 19, n = 8, n = 8, and n = 14) and raised sine (right, GABA; n = 13, n = 7, n = 11, and n = 9. GLU; n = 18, n = 8, n = 7, and n = 14). The numbers in the figures indicate the number of data in each bar. C, E, The parameters were significantly different among the regions, but not between cell types: *p < 0.05; **p < 0.01.

