
Figure 2.
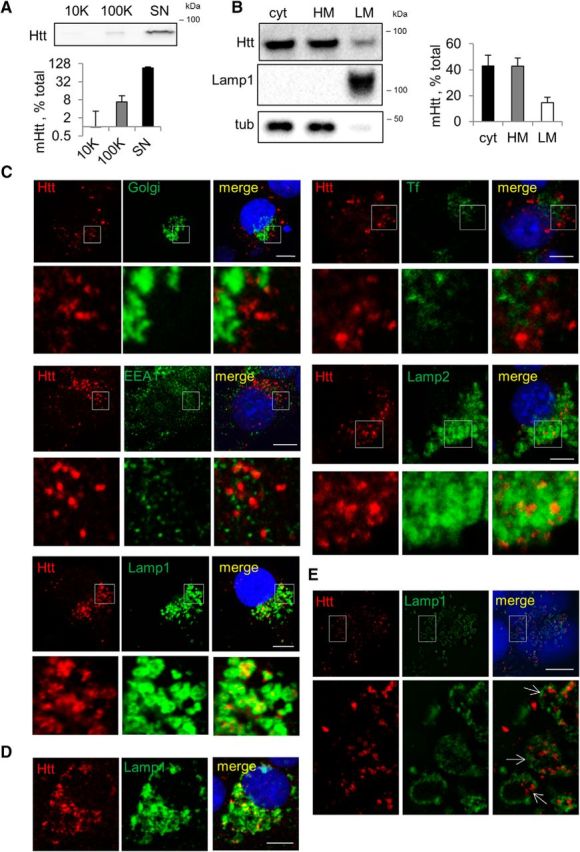
Intracellular mHtt localizes to LE/Lys vesicles, whereas secreted mHtt exists in a free form. A, Extracellular mHtt is predominantly in a free form. Top, OptiMEM conditioned for 24 h on Neuro2A-mHtt was collected and sequentially centrifuged on 2000 × g to eliminate cell debris, 10,000 × g to pellet ectosomes, and 100,000 × g to pellet exosomes. The remaining supernatant was concentrated. The 10,000 × g pellet, the 100,000 × g pellet, and the concentrated supernatant were analyzed by Western blotting using anti-Htt antibody. Bottom, Relative amount of mHtt in each fraction expressed as a percentage of total mHtt. n = 3. B, Portion of intracellular mHtt is localized in the light membrane fraction. Left, Postnuclear supernatant (PNS) obtained from Neuro2A-mHtt cells was subjected to floatation in the sucrose density gradient and 2 μg of cytosolic (cyt), heavy membrane (HM), and light membrane (LM) fractions were analyzed by Western blotting using anti-Htt antibody. Lamp1 and tubulin were used as light membrane and cytosolic markers, respectively. Right, Relative amount of mHtt in each fraction expressed as a percentage of total mHtt. n = 3. C, mHtt-containing vesicles colocalize with Lamp1-positive compartments. Neuro2A-mHtt cells were transduced with CellLight Golgi-GFP (top left), treated 20 min with 20 μg/ml transferrin-Alexa Fluor 488 (top right), or left untreated (remaining panels). Cells were then pre-permeabilized, fixed, immunolabeled with anti-Htt (all), anti-EEA1 (second raw left), anti-Lamp2 (second row right), or anti-Lamp1 (third row) antibodies; and analyzed by confocal microscopy. D, Primary cortical neurons derived from rat embryos and transduced with Htt571/72Q lentivirus were pre-permeabilized and fixed 7 d after transduction, immunolabeled with anti-Htt and anti-Lamp1 antibodies, and analyzed by confocal microscopy. E, Vesicular mHtt is found within the lumen of Lamp1-positive vesicles. Untreated cells were pre-permeabilized, fixed, immunolabeled with anti-Htt and anti-Lamp1 antibodies, and analyzed by N-SIM. Nuclei were visualized using DAPI staining. Scale bar, 10 μm. Error bars indicate SD.