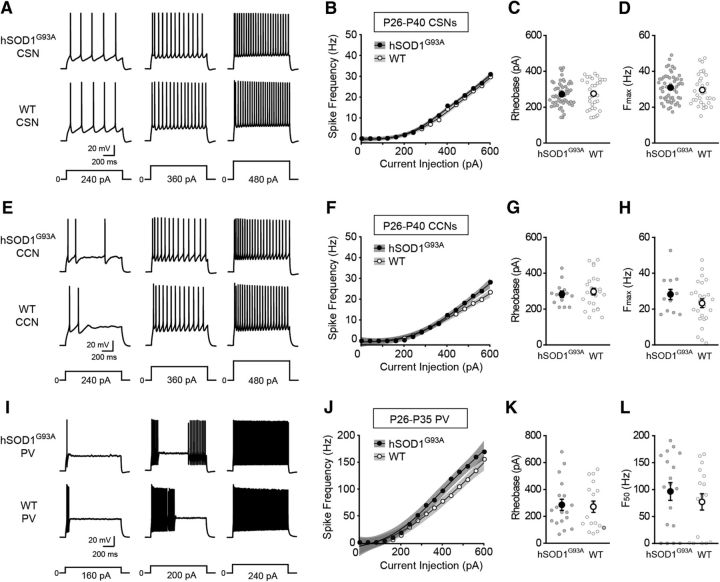
Figure 5.
The intrinsic excitability in cortical neurons in presymptomatic hSOD1G93A mice. A, E, Representative voltage traces recorded from CSNs (A) and CCNs (E) from P26–P40 hSOD1G93A;Gad67-GFP (hSOD1G93A) and Gad67-GFP (WT) mice evoked by 240, 360, and 480 pA current steps, as indicated. B, F, The current–spike frequency relationship measured from CSNs (B; hSOD1G93A: n = 56 cells from 12 mice; WT: n = 33 cells from 11 mice; p < 0.0119, Wald test) and CCNs (F; hSOD1G93A, n = 13 cells from 5 mice; WT, n = 25 cells from 7 mice; p < 0.0779, Wald test,) from hSOD1G93A and WT mice. C, G, The rheobase measured from CSNs (C; hSOD1G93A, 271.95 ± 8.73 pA; WT, 275.3 ± 14.27 pA; p = 0.6434, Mann–Whitney test) and CCNs (G; hSOD1G93A, 282.85 ± 18.12 pA; WT, 297.56 ± 19.1 pA; p = 0.7233, Mann–Whitney test). D, H, The Fmax measured from CSNs (D; hSOD1G93A, 30.95 ± 1.01 Hz; WT, 29.59 ± 1.5 Hz; p = 0.337, Mann–Whitney test) and CCNs (H; hSOD1G93A, 28.18 ± 2.85 Hz; WT, 23.27 ± 2.43 Hz; p = 0.2801, Mann–Whitney test). I, J, Representative voltage responses (I) and the current–spike frequency relationship (J) measured from PV interneurons in P26–P35 mice (hSOD1G93A, n = 18 cells from 6 mice; WT, n = 17 cells from 7 mice; p < 0.00375, Wald test). K, The rheobase measured from PV interneurons (hSOD1G93A, 285.83 ± 41.41 pA; WT, 271.29 ± 41.91 pA; p = 0.692, Mann–Whitney test). L, The F50 measured from PV interneurons (hSOD1G93A, 96.5 ± 16.47 Hz; WT, 77.08 ± 15.15 Hz; p = 0.3843, Mann–Whitney test).

