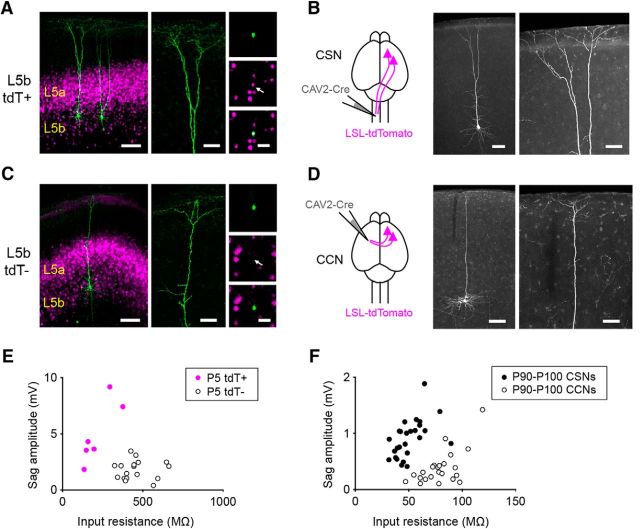
Figure 6.
Cre expression in L5b of Rbp4-Cre mice distinguishes corticospinal and corticocortical neurons. A, Low- and high-magnification images of biocytin-filled L5b tdTomato-positive cells from a P5 Rbp4-Cre;tdTomato mouse. B, Schematic showing the experimental setup (left) and low- and high-magnification images of a corticospinal neuron (right) revealed by injecting a canine adenoviral vector carrying a construct for Cre recombinase (CAV-Cre) into the cervical spinal cord of a P90 tdTomato Cre-reporter mouse. C, Low- and high-magnification images of a biocytin-filled L5b tdTomato-negative neuron from a P5 Rbp4-Cre;tdTomato mouse. D, Schematic showing the experimental setup (left) and low- and high-magnification images of a corticocortical neuron (right) revealed by injecting CAV-Cre into the contralateral motor cortex of a P90 tdTomato Cre-reporter mouse. E, F, Summary data showing the input resistance and sag amplitude for L5b tdTomato-positive and tdTomato-negative neurons recorded from P5–P6 Rbp4-Cre;tdTomato mice (E, n = 6 tdTomato-positive neurons from 3 mice; n = 17 tdTomato-negative neurons from 7 mice; input resistance: L5b tdTomato-positive neurons, 220.2 ± 39.4 MΩ; L5b tdTomato-negative neurons, 460.3 ± 24.7 MΩ; p = 0.0009, Mann–Whitney test; Sag amplitude: L5b tdTomato-positive neurons, 4.9 ± 1.1 mV; tdTomato-negative neurons, 1.8 ± 0.2 mV; p = 0.0037, Mann–Whitney test) and P90–P100 retrogradely labeled CSNs and CCNs (F; n = 26 CSNs from 8 mice; n = 23 CCNs from 8 mice; input resistance: CSNs, 50.8 ± 2.7 MΩ; CCNs, 79.5 ± 3.5 MΩ; p < 0.0001, Mann–Whitney test; Sag amplitude: CSNs, −0.8 ± 0.1 mV; CCNs, −0.4 ± 0.1 mV; p < 0.0001, Mann–Whitney test). Scale bars: A, C, left, 100 μm; A, C, middle, 50 μm; A, C, right, 30 μm; B, D, left, 100 μm; B, D, right, 50 μm.

