Figure 8.
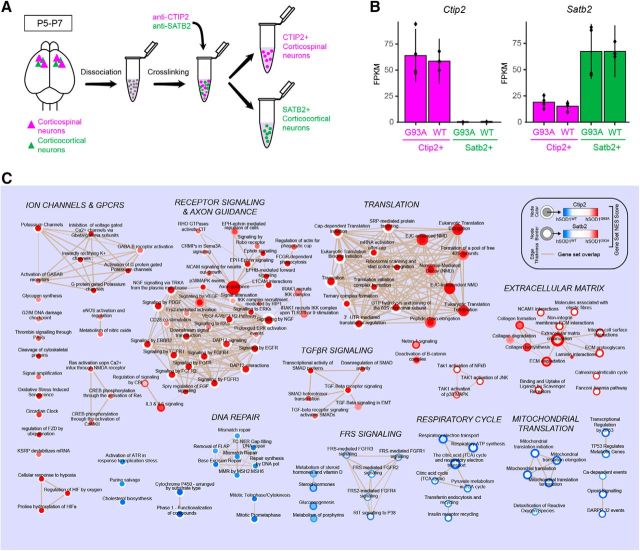
Gene set enrichment analysis implicates distinct molecular mechanisms in corticospinal and corticocortical neurons from hSOD1G93A mice. A, Schematic of the experimental procedure for selective purification of two different molecularly identified cortical projection neuron populations. Total RNA from CTIP2-positive corticospinal neurons and SATB2-positive corticocortical neurons was purified for RNA-seq analysis using cell type-specific antibodies. B, Ctip2 and Satb2 expression profiles for molecularly identified cell types from hSOD1G93A and hSOD1WT mice (n = 4 mice/group). C, Enrichment map of significantly enriched Reactome gene sets from hSOD1G93A vs hSOD1WT RNA sequencing analyses in CTIP2-positive corticospinal neurons (CSNs) and SATB2-positive corticocortical neurons (CCNs). Node color corresponds to gene set enrichment (red) or depletion (blue) in hSOD1G93A CSNs relative to hSOD1WT CSNs. The border color represents gene set enrichment or depletion results for CCNs. White indicates no significant enrichment or depletion for a given gene set for that cell type. Node areas correspond to relative gene set sizes, and line thicknesses (tan) indicate the degree of overlap in gene composition between connected sets. Gene sets were determined to be significantly enriched or depleted using a preranked gene set enrichment analysis (Kolmogorov–Smirnov test, p < 0.05, Benjamini–Hochberg corrected). Supporting data are found in Figure 8-1 available at https:/10.1523/JNEUROSCI.0811-17.2017.f8-1.

