
Fig. 2.
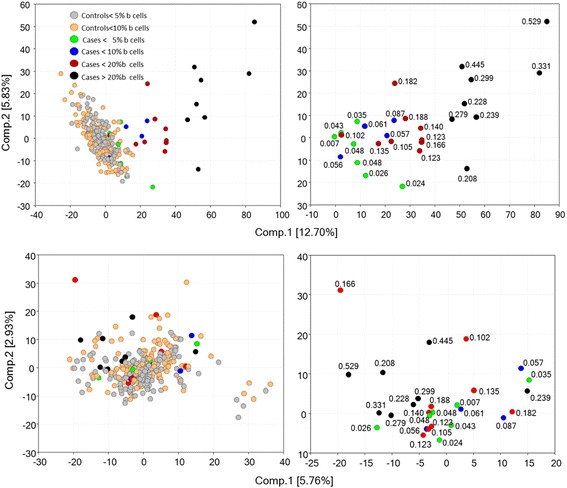
Top: PCA based on 1308 CpG sites significant (FDR < 0.05) in CLL cases and with minimal variation between WBC sub-populations. Bottom: similar analysis with 1308 CpG sites randomly selected from among those with FDR > 0.8 in CLL cases and with minimal variation between WBC sub-populations. The signal intensities employed were denoised for various parameters, including B-cell content (see Methods). The numbers in the Figures on the right indicate the fractional B-cell content of the samples. The Figures on the left show all subjects while those on the right show only the CLL case subjects