Fig. 4.

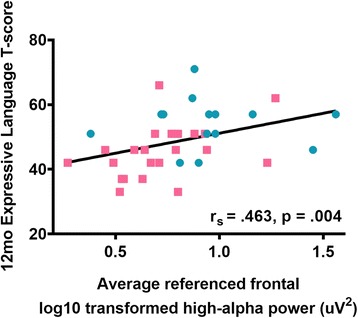
Spearman’s rho correlations (with fitted line) between 3-month frontal power (log10 transformed) in the high-alpha (9–13 Hz) band and T scores on the MSEL expressive language subscale for LRC (cyan circles) and HRA (pink squares) infants

Spearman’s rho correlations (with fitted line) between 3-month frontal power (log10 transformed) in the high-alpha (9–13 Hz) band and T scores on the MSEL expressive language subscale for LRC (cyan circles) and HRA (pink squares) infants