Fig. 5.

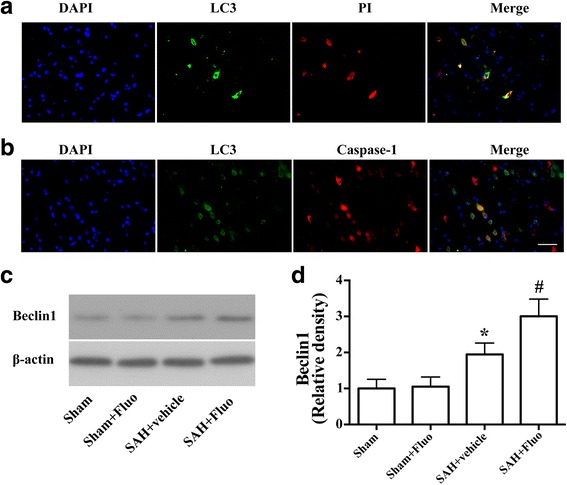
Autophagy activation was involved in the protective effect of fluoxetine on NLRP3 inflammasome activation. a Double fluorescence of PI staining (red) and cells with autophagy marker LC3 (green). b Representative micrographs showing double immunofluorescence with caspase-1 (red) and LC3 (green). Scale bar = 50 μm. c Representative Western blots and d densitometric analyses of levels of beclin-1 (n = 6). The bars represent the mean ± SD. *P < 0.05 vs sham control, # P < 0.05 vs vehicle control
