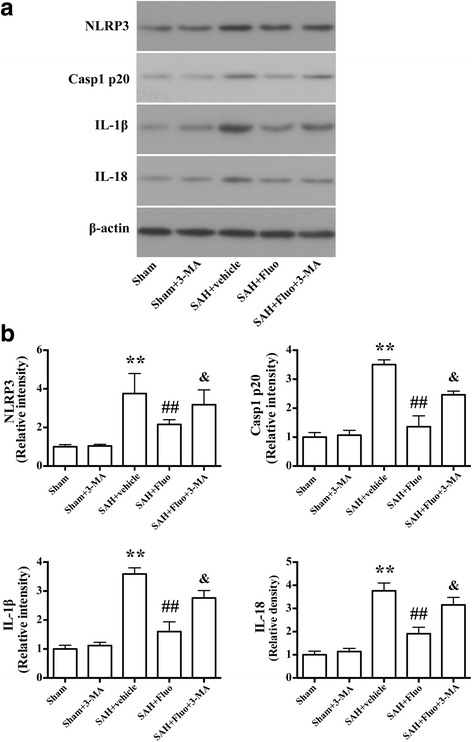
Fig. 6.

Autophagy inhibitor 3-MA blocks the effects of fluoxetine on expression of NLRP3, caspase-1 p20, IL-1β, and IL-18 after SAH induction. a Representative Western blots of NLRP3, caspase-1 p20, IL-1β, and IL-18. b Densitometric analyses of levels of NLRP3, caspase-1 p20, IL-1β, and IL-18. N = 6. The bar represents the mean ± SD. **P < 0.01 vs the sham group. ## P < 0.01 vs SAH + vehicle group. & P < 0.05 vs SAH + fluo group. Representative photomicrographs and the quantification of the PI-positive neural cells in different groups at 24 h after SAH (n = 3/group). Fluorescence colors: DAPI: blue and PI: red. Scale bar = 100 μm, the quantification of the PI-positive neural cells expressed as a percent of the total DAPI+ cells. The bar represents the mean ± SD. **P < 0.01 vs SAH + vehicle group. ## P < 0.01 vs SAH + fluoxetine group
