
Fig. 10.
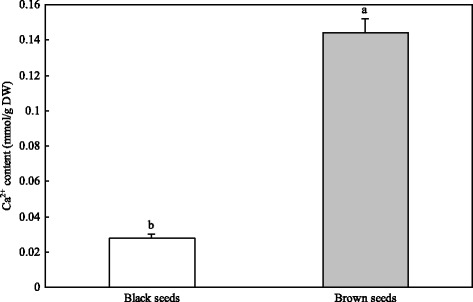
The concentration of Ca2+ in S. salsa dimorphic seeds. The values are presented as mean + standard deviation (SD), n = 3. The difference in means with different letters was statistically significant at P ≤ 0.05
Official websites use .gov
A
.gov website belongs to an official
government organization in the United States.
Secure .gov websites use HTTPS
A lock (
) or https:// means you've safely
connected to the .gov website. Share sensitive
information only on official, secure websites.
The concentration of Ca2+ in S. salsa dimorphic seeds. The values are presented as mean + standard deviation (SD), n = 3. The difference in means with different letters was statistically significant at P ≤ 0.05