
Fig. 2.
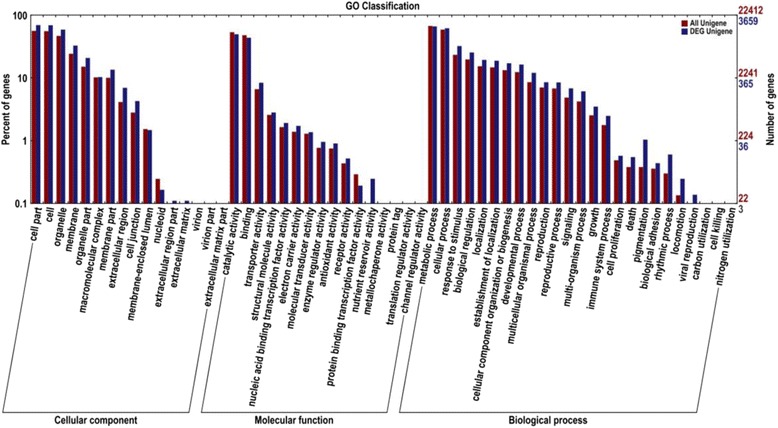
The gene ontology (GO) annotations of all annotated unigenes are shown. These results were summarized under the three main GO categories: biological process, cellular component and molecular function. The right Y-axis indicates the number of genes in each category. The left Y-axis indicates the percentage of a specific category of genes in the corresponding GO category