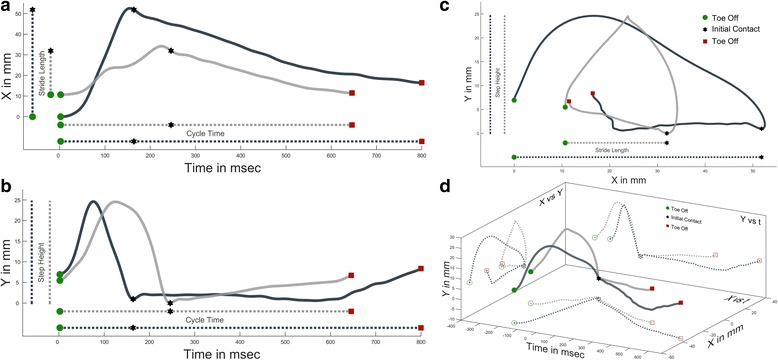
Fig. 2.

Multidimensional Differences Between Two Steps. Two non-consecutive steps from the same training session of a pre-injury rat. As a step progresses from toe off (green circle), to initial contact (black star), to subsequent toe off (red square) the x,y,t coordinates are recorded. Traditional 2D representations of this data are found in plots a-c with classic gait measures shown as 1D projections of the 2D data. d shows the 2D plots of a-c as projections of a 3D representation of the steps, with initial contact at the origin
