
Table 7.
MIC distributions and occurrence of resistance of Staphylococcus schleiferi (n = 20) isolates from Danish mink (2014–2016)
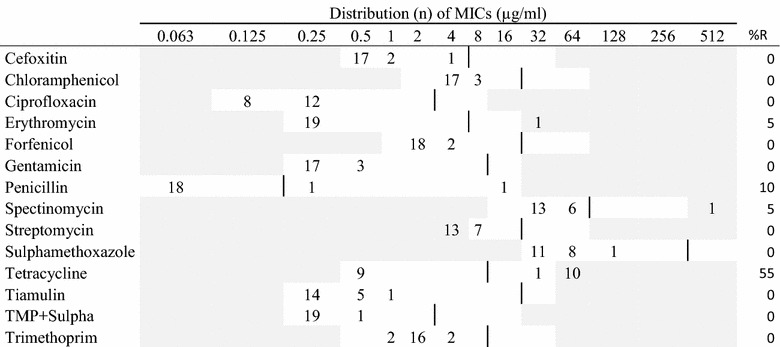
Vertical lines indicate breakpoints for resistance (see breakpoint table in Additional file 1 B). White fields indicate test range for each antimicrobial. Values greater than the test range represent MIC values greater than the highest concentration in the range. MICs equal to or lower than the lowest concentration, are given as the lowest concentration in the test range