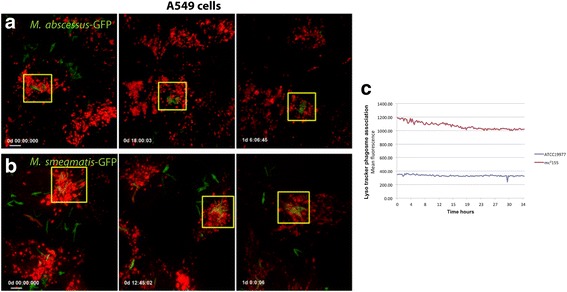
Fig. 5.

Live cell imaging of infected A549 cells pre-loaded with LysoTracker Red. a M. abscessus ATCC 19977 and (b) M. smegmatis infection in A549 cells for 36 h. Time of image acquisition is depicted as days:hours:minutes:seconds (d:hh:mm:ss) and image acquisition started after 2 h of infection. c Mean fluorescence intensity of LysoTracker Red quantified from square regions in A and B. Total of 5 cells containing phagosomes were analyzed per condition. Bar: 10 μm
